The close that arrives in one tick
On 3 August 2026 India replaced the closing price of its most liquid stocks with an auction. I captured the first three sessions tick by tick. The headline effect — a two-hundred-point index candle printing after cash trading had stopped — decayed by three quarters within three days; the trade that looked most obvious turns out to sit in a window with no order book in it; and the one effect that grew rather than shrank was the one nobody was looking at.
On 3 August 2026, SEBI replaced the way the closing price is determined for the roughly two hundred Indian stocks that have listed derivatives. The old method was a volume-weighted average of the last thirty minutes of continuous trading. The new one is a Closing Auction Session: continuous trading stops at 15:15, orders are collected for about a quarter of an hour, and a single uniform price is struck at which the maximum quantity can trade.
On the first day, the NIFTY 50 closed 200.95 points above where it had been trading fifteen minutes earlier. The entire move arrived in one tick. Retail traders watching a screen saw a large green candle appear after the cash market had already stopped, and the reaction was immediate and loud: the close was being manipulated.
I had a tick capture running. This post is what three consecutive sessions of it show — days one, two and three — and, more importantly, which of the loud first-day claims survive contact with a control group.
The short version is that the dramatic thing decayed fast, the boring thing did not decay at all, and the piece of it that looked most like a trading opportunity turns out to sit in a window where there is no market to trade in. The trade that survives that objection is somewhere else, and it is not yet proven.
The measurement problem comes first
Before any finding, a caveat that governs everything below, because it is the kind of thing that quietly invalidates an entire analysis.
My data is a throttled WebSocket snapshot capture — a retail feed, sampling the book every few hundred milliseconds — not an exchange trade tape. A "tick" here is a snapshot, not a trade. Counts of snapshots are a liquidity proxy and nothing more. Anywhere I say activity rose or fell, I mean the quote-update rate changed, which is correlated with trading but is not a measurement of it.
There is also a specific trap in this dataset that cost me real time, and I mention it because anyone else pulling Indian tick data across this date range will hit it. On CAS days the feed restarts the cumulative daily volume counter at 15:15, reports auction-window volume from zero, then snaps back to the true full-day cumulative around the cross. If you diff that counter naively — which is the obvious way to get per-minute volume — you book the snap-back as a single minute of roughly 333 million shares for the NIFTY 50 basket. That is about sixty times too large, and it is not real.
I nearly published it. It repeats on all three CAS days, in 208 of 208 eligible names, so it is a permanent property of the feed under the new regime rather than a first-day glitch. Any volume figure spanning 15:15 to 15:30 that has not explicitly handled the restart is wrong, including several I have seen quoted.
I state this first because the rest of the post asks you to believe a set of numbers, and the reason to believe them is that this one was caught.
The natural experiment nobody has to construct
The single most useful fact about this rule change is that it applies to some stocks and not others. Stocks with listed derivatives get the auction. Everything else — several hundred names on the same exchange, the same day, the same macro news, the same feed — keeps trading continuously until 15:30 exactly as before.
That is a control group handed to you for free, and it is what separates "the auction did something" from "the market moved that afternoon."
I built a fixed panel: the 208 auction-eligible names and 697 non-eligible ones present in every session across the eight days studied, ETFs removed. The universe is rebuilt each morning and drifts by a few names, so intersecting across dates is what keeps composition change from masquerading as an effect. Then for each stock I measured one number: the move from its last two-sided quote before 15:15 to its final settled price of the day, measured on the same 15:15 clock on pre-auction days so the comparison is structural rather than calendar-shifted.
Here is the whole study in one table.
| mean signed move | % of names closing up | |
|---|---|---|
| Auction-eligible, 27–31 Jul (pre-CAS) | −7.2 to +9.5 bps | 39–61% |
| Auction-eligible, 3 Aug | +46.9 bps | 82% |
| Auction-eligible, 4 Aug | +25.6 bps | 68% |
| Auction-eligible, 5 Aug | +16.0 bps | 64% |
| Control, 27–31 Jul | −3.6 to +3.8 bps | 44–52% |
| Control, 3 Aug | −1.5 bps | 44% |
| Control, 4 Aug | −3.0 bps | 44% |
| Control, 5 Aug | −3.8 bps | 40% |
Two things are happening at once and they should be read separately.
The first is that the auction genuinely does something, and it is not subtle. Before the change, the eligible group's mean signed move wandered around zero — individual names moved, but they cancelled across the cross-section, which is what you expect when the close is just more trading. On auction days the median absolute move and the mean signed move converge, which is the arithmetic signature of nearly every name moving the same direction at once. That is a level shift, not dispersion. Meanwhile the control group's signed move on those same three days sits inside its own pre-change range every single day, and its share of up-closes does not budge. Whatever is moving the auction basket is not touching the stocks that kept trading.
The second is that it is decaying fast. Forty-seven basis points, then twenty-six, then sixteen. Restricted to the NIFTY 50, where the effect is concentrated, the decay is steeper still: +81.4, then +65.5, then +24.9 bps, with the share of index constituents closing up falling from 96% to 96% to 72%. On day two, two of fifty NIFTY 50 names closed below their 15:15 price. On day three, fourteen did.
The index-level picture tells the same story. The largest single-tick move in the NIFTY 50 in the final half hour was +200.95 points on day one, +151.45 on day two, and +54.45 on day three — against a pre-change baseline of 7.90 points on 31 July. Still a sevenfold amplification on day three. But down from twenty-five-fold.
The direction question, which is the one that mattered
Every writeup of day one, mine included, ran into the same wall: with one observation you cannot distinguish "the auction systematically pushes the close up" from "the auction amplifies whatever direction the day was already going, and that day went up."
Three sessions answer it, and the answer is not the comfortable one.
| date | index open → 15:14 | auction move |
|---|---|---|
| 3 Aug | +0.02% | +200.90 pts |
| 4 Aug | −0.76% | +151.50 pts |
| 5 Aug | −0.31% | +52.40 pts |
Two of the three sessions were down days into the close. The auction pushed the close up on all three. On two of three days it moved against the intraday direction.
So the amplification story is dead, at least across these three sessions. What replaces it is a genuine puzzle: something in this auction has a persistent upward bias. The obvious candidate is a structural buy imbalance from passive and index flow, which is precisely the constituency the reform was designed to serve — SEBI's stated rationale was letting passive funds transact at the official close and reduce tracking error. If index funds systematically arrive at the auction as net buyers, an upward-biased clearing price is exactly what you would expect.
I want to be clear that I have not established that. It is the mechanism most consistent with the data I can see, and the data I would need to confirm it — the auction order book, the imbalance path, the indicative price history — is not in a retail feed. Anyone claiming to know why the auction clears where it does, in either direction, is claiming more than this kind of data can support. That includes the manipulation claim and it includes my passive-flow guess.
What the circular says, and what actually happened
One finding is purely factual and has an operational consequence, so it is worth stating plainly.
The broker circulars describe order matching as occurring between 15:30 and 15:35, following a randomised order-entry cutoff somewhere between 15:28 and 15:30. I measured the actual cross directly rather than trusting the timetable: for each stock, the instant its two-sided quote disappears from the feed is the instant matching began.
| date | median cross time | basket span |
|---|---|---|
| 3 Aug | 15:29:06 | 4.5 s |
| 4 Aug | 15:28:22 | 16.5 s |
| 5 Aug | 15:28:43 | 10.4 s |
Three sessions, three distinct times, spanning forty-four seconds — every one inside the documented random window, and every one before the 15:30 the circulars point at. By 15:30 on all three days the closing price already existed. The 15:30–15:35 window is when confirmation completes, not when the price is decided.
The whole 208-name basket crosses within a few seconds of itself, which is consistent with one system-wide matching event rather than per-symbol auctions.
The operational consequence: anyone planning to place or pull an order "just before the cutoff" is timing an instant that is deliberately unknowable and has already varied by forty-four seconds across the only three observations that exist. On day two, an order intended for 15:29 would have missed the auction entirely. This is the part of the design working as intended — the randomisation exists precisely to make last-instant gaming unprofitable — but it deserves to be stated as observed behaviour rather than repeated from a circular that the data contradicts.
The futures market never agreed, until it did
Here is where the first-day outrage came from, and it is a real thing rather than a misperception.
Index futures kept trading continuously through the entire auction window, on their own order book, all the way to 15:40. So for about thirteen minutes there were two prices for the same underlying: a frozen, stale cash index, and a live futures price. When the auction struck, the cash index jumped to meet a market that had been trading the whole time.
The basis — futures minus spot — is the cleanest way to see it.
| date | basis before cross | basis after |
|---|---|---|
| 27–31 Jul (pre-CAS) | −2.8 to +71.8 | −1.4 to +75.0 |
| 3 Aug | +62.2 | −114.2 |
| 4 Aug | +90.6 | −60.7 |
| 5 Aug | +86.5 | +22.9 |
For five pre-change sessions the basis barely moves across the close — whatever it was at 15:14, it is within a few points of that afterwards, the largest pre-change shift being 30 July at +20.5 points. Note also that 28 July sat slightly negative all afternoon, so a negative basis is not itself unprecedented. What is new is the magnitude, the sign of the change, and the fact that it arrives in a single tick rather than drifting there. On day one it goes from +62 to −114 points in a single tick. And essentially all of that comes from the spot leg: on day one spot moved +197.05 points from 15:14 to its close while the future moved +24.45 to its own 15:40 close. The cash index was restated; the futures market was not.
But look at day three. The basis compressed by 64 points and stayed positive. Spot did not overshoot the futures price — it converged toward it and stopped.
That distinction carries a lot of weight. On days one and two, spot crossed from below futures to above them. That overshoot is what ruled out the benign interpretation — "the auction simply discovered the fair price that futures already knew" — because if that were the mechanism the basis would converge toward zero and halt, not sail through it. On day three the data is consistent with exactly that benign reading. Whether days one and two were a transitional overshoot that has now resolved, or whether the basis will invert again on the next volatile close, three sessions cannot tell you.
The part that looked tradeable
If the auction pushes prices to a level the continuous market does not ratify, the obvious question is whether the market takes it back — and whether you can be paid for that.
The cross-sectional version of this replicates cleanly. Regressing each stock's overnight move against its auction jump gives a slope where −1 means the auction move is entirely undone by the next open and 0 means it sticks:
| transition | auction-eligible slope | control slope |
|---|---|---|
| 3 Aug → 4 Aug | −0.674 | +0.08 |
| 4 Aug → 5 Aug | −0.615 | +0.44 |
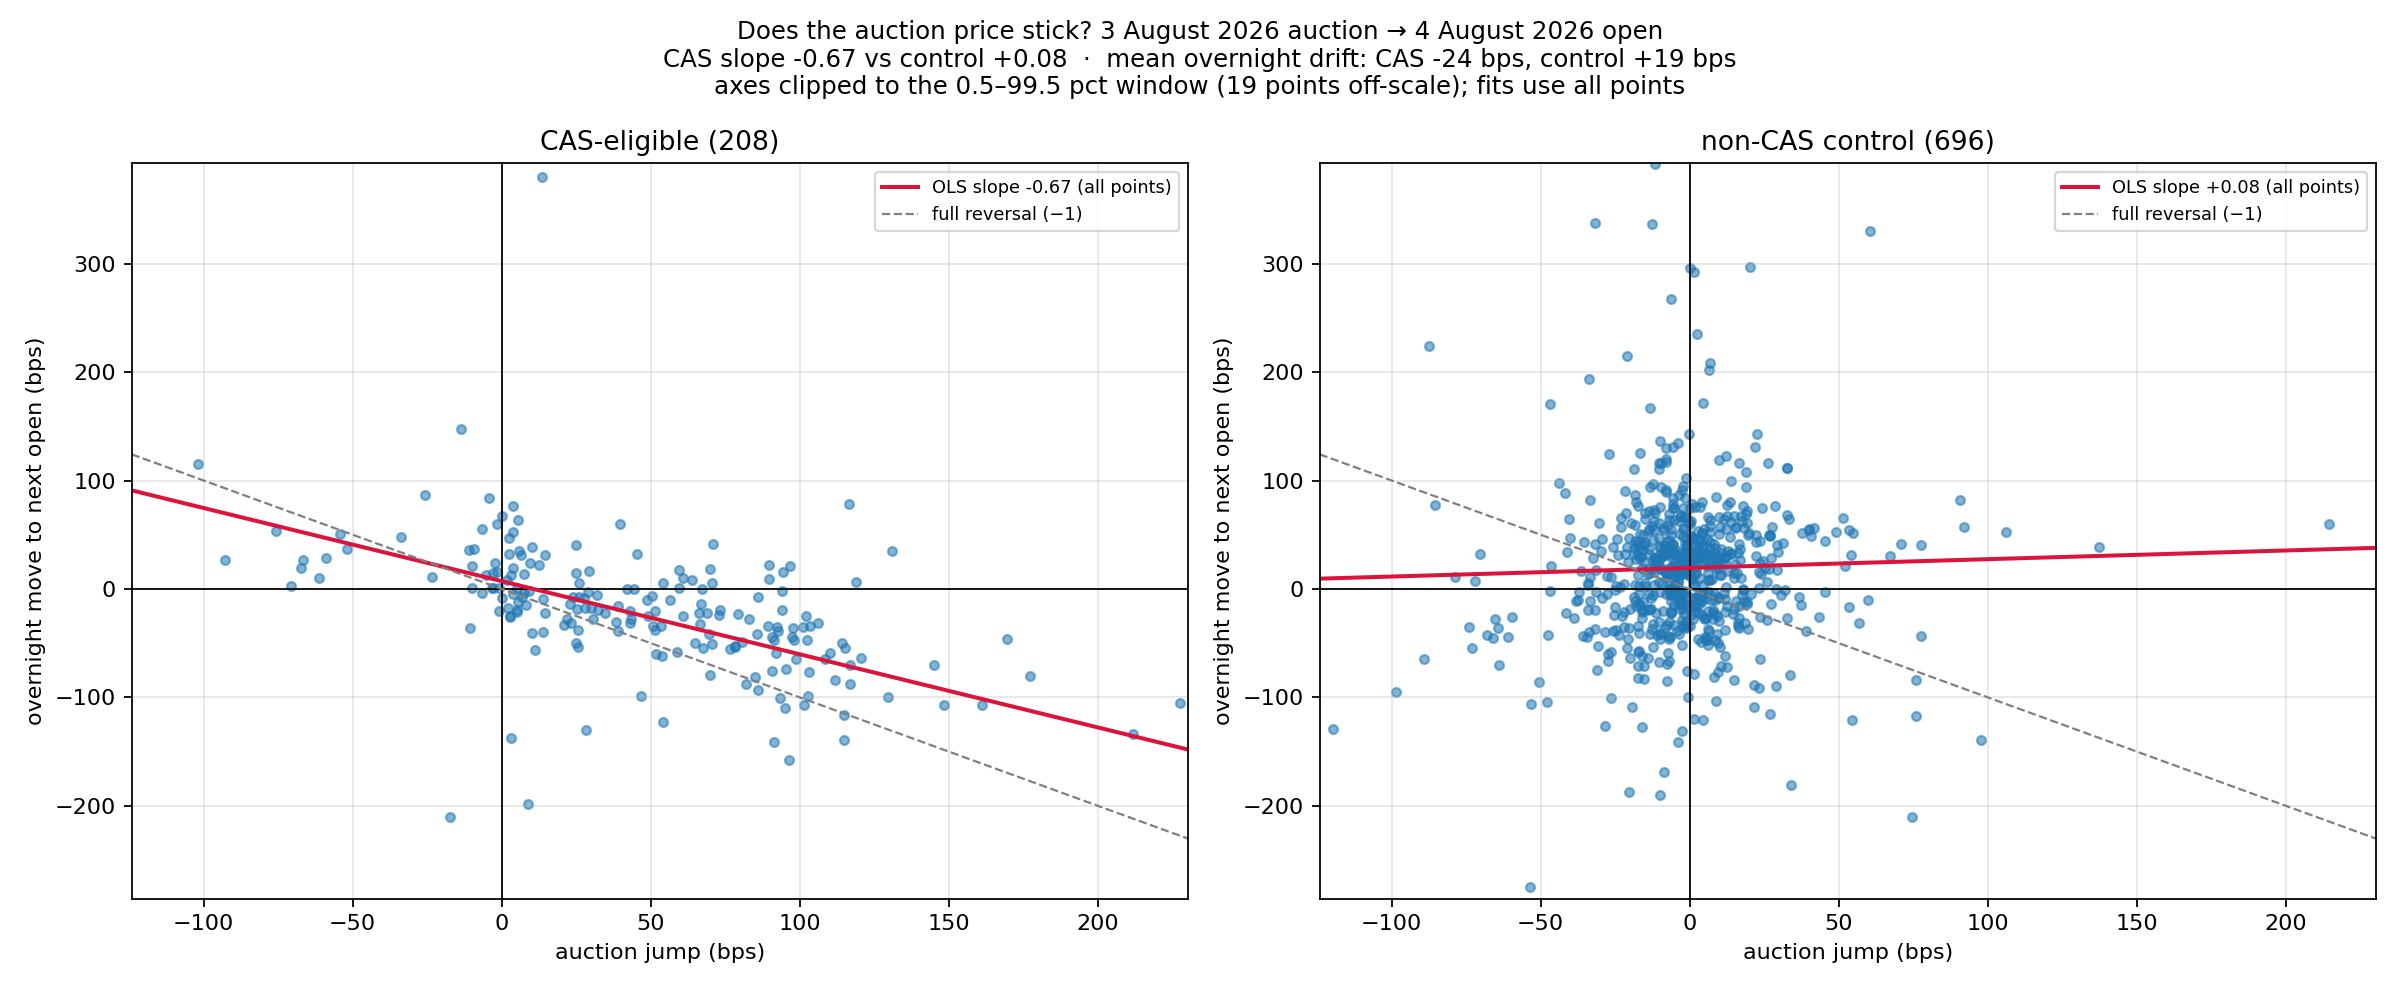
First transition. Each point is one stock: its auction jump on the horizontal axis, its move from the auction close to the next morning's open on the vertical. The CAS panel has a clear downward tilt (fitted slope −0.67, dashed line showing what a full −1 reversal would look like); the control panel, same day and same feed, has none. Axes are clipped to the 0.5–99.5 percentile window for legibility — 19 points sit off-scale — but the fits use every point.
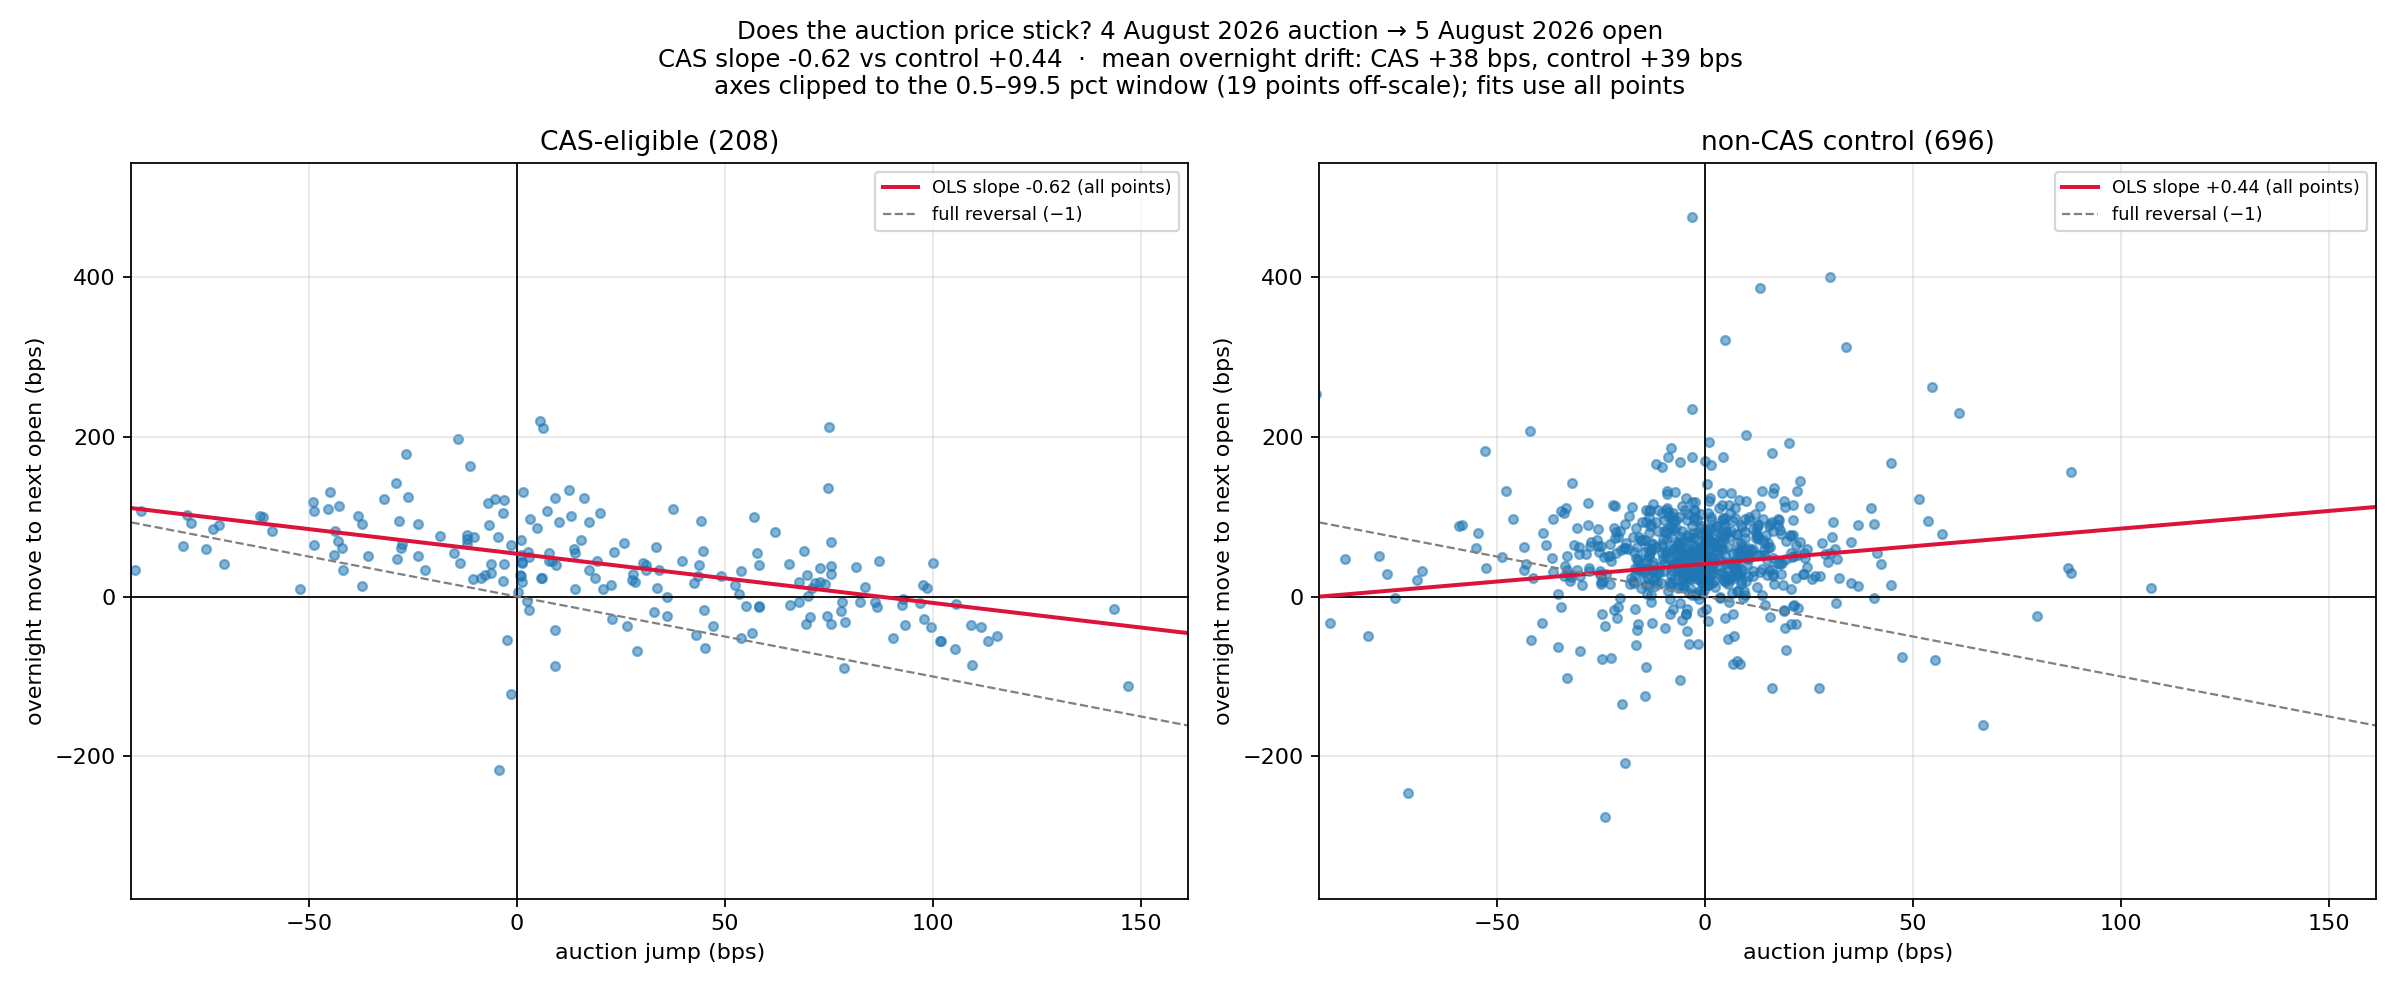
Second transition, and the reason the first is worth taking seriously. The CAS slope comes back at −0.62 against a control slope of +0.44. Note the vertical shift between the two figures: overnight drift was −24 bps for CAS names on the first transition and +38 bps on the second, which is the group-level effect that appears and disappears below. The tilt survives that shift; the level does not.
Across both observed overnight transitions, CAS stocks exhibit a stable cross-sectional mean-reversion pattern: larger auction-induced price jumps reverse by roughly two thirds on average by the next opening auction, while no comparable relationship appears in non-CAS stocks.
Three things are being separated there, and it is worth being explicit because all of them get called "decay" and only two of them are the same kind of object. At the market level, the upward bias in auction closes is shrinking across successive sessions — +47, +26, +16 bps, a time-series average across days. At the stock level, within a single session, unusually large auction moves do not fully stick; they give back roughly 60–70% by the next open — a cross-sectional relationship inside a day. At the control level, ordinary stocks show neither. The first is the headline effect fading. The second is a conditional structure that has so far held while the headline faded. Conflating them would let a shrinking market-wide bias be read as evidence that individual auction dislocations are becoming stickier, or vice versa, and neither follows.
Two further precisions on what the slope is and is not. It is an average conditional relationship, not a statement about individual stocks: −0.65 describes the fitted line through a cloud with large idiosyncratic dispersion, and plenty of names in either panel move the other way. And it establishes a replicated negative association, which is not the same as a stable ranking. Demonstrating that the ranking itself persists would need rank correlations, decile sorts or information coefficients; what these two figures show is monotone mean reversion, not ranking persistence.
The regression is the primary result here, because a slope that replicates across two independent overnight transitions against a clean control is stronger evidence than any set of named cases. But the named cases corroborate it, and they were written down in advance. After the second session I wrote down four falsifiable predictions for the third — before the data existed — including naming the three stocks with the largest day-two auction jumps and predicting they would underperform at the next open. NESTLEIND, APOLLOHOSP and SBILIFE came back −88.5, −144.5 and −111.9 basis points against a group mean of +37.8. The top ten jumpers averaged −58.6 against that same +37.8, a spread of ninety-six basis points. Anecdote with a timestamp on it, which is the only kind worth much.
Two of my four predictions failed, and the failures are more instructive than the hit. I predicted the index would open between 24560 and 24600, below the auction close and reverting toward the futures price. It opened at 24647.65 — above the auction close and 95 points above the prior futures close. On the first transition futures had been the better predictor of the next open by roughly eight and a half times; on the second, the auction close was the better predictor by about three. A confident sentence I had written after two days — that futures are the better overnight mark, and that this was "the whole thesis" — did not survive its first out-of-sample test.
So: the cross-sectional mean reversion replicated, and the index-level direction did not.
Why it is not a trade
This is where I expected to find something, and did not, and the reason is worth more than the finding would have been.
Run the naive strategy — short the biggest auction jumpers, cover at the next open — across both transitions, with the round-trip cost wall computed exactly rather than estimated (4.49 basis points at ₹5 lakh notional through a validated cost library, not a rule of thumb):
| filter | transition 1 net | transition 2 net |
|---|---|---|
| jump > 0 bps | +34.1 bps | −27.2 bps |
| jump > 75 bps | +74.2 bps | +14.3 bps |
The first transition looks spectacular and the second mostly gives it back. The reason is the split between the two claims above. On transition one the auction group fell 24.4 basis points overnight while the control rose 19.3 — a real group-level divergence. On transition two the auction group rose 37.8 and the control rose 39.5. Nearly identical. The cross-sectional tilt was still there, but the group-level edge that made transition one profitable simply was not.
This is the level/tilt distinction from the previous section showing up in a P&L column. The cross-sectional slope is a statement about relative moves within the auction basket; an outright short is exposed to the basket's absolute overnight drift, which the slope says nothing about and which flipped sign between the two transitions.
Market-adjust it — subtract each day's control drift, which isolates the auction-specific component — and the effect replicates on both transitions, monotonically improving with selectivity, 88% win rate at the tightest filter. But a market-adjusted return is not a return. Capturing it requires shorting the auction basket and hedging the market: a long-short book, not the outright short, with different margin and different constraints.
And then there is the fact that kills it regardless. I checked whether you can actually transact at or near the auction price after it prints. Across all 208 eligible names on 5 August, from the cross to the end of capture at 15:40:
2,223 snapshots. Zero two-sided quotes.
Not "wide spreads." No book at all. The roughly 190 snapshots per minute after the cross are heartbeat repetitions of a frozen price. The auction close is an observable number, not an accessible one. Which means the earliest a retail participant can enter is the next morning's open — which is precisely the moment the reversal has already occurred. Testing what remains after the open, there is no consistent edge and the sign flips between the two transitions.
So the reversal is real, measurable, and replicates. It also sits entirely inside a window where there is nothing to trade against. Those are compatible facts, and holding both is the honest position. The two figures above are, if anything, the strongest argument that the cash leg is closed: the reversal they show is an overnight phenomenon, resolved by the next opening auction, so the only ways to be paid for it are to participate in the auction itself or to hold an instrument that keeps trading through it.
Where the trade actually is, if there is one
I do not think a market-structure post that stops at "interesting but untradeable" has finished its job. Markets are for trading. So: given everything above, where would I actually look?
Not at the cash leg. That is settled — there is no book.
The place to look is the instrument that kept trading through the whole thing. Every CAS-eligible stock has a single-stock future, and those futures never froze. They traded continuously on their own book to 15:40, right through the auction, with no band and no vanished quote.
So I measured, for all 208 names on all three days, how much of the cash restatement the stock's own future reproduced over the identical window.
| date | cash restatement | its futures | futures / cash | cross-sectional corr |
|---|---|---|---|---|
| 3 Aug | +46.9 bps | +5.7 bps | 12.1% | 0.11 |
| 4 Aug | +25.6 bps | +0.8 bps | 2.9% | 0.07 |
| 5 Aug | +16.0 bps | +1.4 bps | 8.5% | 0.05 |
Single-stock futures ratify between three and twelve percent of the cash restatement, with a cross-sectional correlation of roughly zero. Two prices for the same asset, minutes apart, disagreeing by tens of basis points — on every session measured, including the one where the index basis did not invert at all.
That is the dislocation stated at its cleanest: not one index observation, but 208 names, three times over. And unlike everything else in this post, one leg of it is executable, because futures do not stop.
Now the part that stops me from calling it a strategy. The tradeable object here would be the spread — restated cash against its unmoved future — and a spread trade needs the two legs to converge. I have established that the gap exists. I have not established that it closes, or in which direction.
The evidence on that is genuinely split. Asking which mark better predicted the next morning's cash open, per name, across all 208:
| transition | auction close | futures-implied |
|---|---|---|
| 3 → 4 Aug | 54.3 bps error | 47.7 bps |
| 4 → 5 Aug | 61.9 bps | 71.9 bps |
One each way. After day one I would have told you futures were the better mark — the index-level version of that comparison favoured futures by about eight and a half times, and I wrote it down as "the whole thesis." The second transition reversed it. At two observations, neither mark is established, and the honest statement is that the dislocation is measured at n=3 while the convergence is measured at n=0.
Those are different claims and only the first has evidence. A spread trade also pays costs on both legs and carries futures margin, which no unmeasured edge should be asked to clear.
So the answer to "where is the trade" is: in the spread, and it is not yet demonstrated to exist. That is a genuinely different statement from the cash-leg case, where the trade is ruled out by structure rather than by insufficient evidence. One is closed. The other is open and is the first thing I will run when a fourth session lands.
There is a second place worth naming, and it is the liquidity migration in the next section — an environment change rather than a directional signal, and the only thing here that is growing.
A word on what I am not claiming. There is no backtest in this post. No equity curve, no slippage model, no walk-forward. The cost figures are computed through a validated library rather than estimated, and the one number I would defend is that a round-trip on ₹5 lakh of intraday equity costs 4.49 basis points. Everything else in this section is a measurement pointing at a hypothesis.
The effect that grew
Every number in this post so far is shrinking. Here is the one that is not.
Quote activity during the auction window (15:16–15:29), as a ratio of each group's own activity in the fifteen minutes before the halt:
| date | auction-eligible | control |
|---|---|---|
| 27–31 Jul | 0.93–1.00 | 0.95–1.07 |
| 3 Aug | 0.22 | 1.30 |
| 4 Aug | 0.19 | 1.18 |
| 5 Aug | 0.22 | 1.39 |
The left column is the auction working as designed: eligible names lose about eighty percent of their quote activity while their book is closed. Stable and structural.
The right column is the one I did not expect. Non-eligible stocks — which have no auction, whose mechanism did not change in any way — get eighteen to thirty-nine percent busier during the auction window, against a pre-change baseline that never left 0.95–1.07. And day three shows the largest spillover of the three.
Attention and liquidity migrate to whatever is still trading. A rule change that formally touches two hundred stocks is measurably changing the microstructure of seven hundred others that it does not cover. Three sessions in, that migration is getting stronger while every headline effect gets weaker.
I have not tested whether it is harvestable and I am not going to speculate here. But it is the most under-examined thing in this dataset and it is the direction I would look next.
Expiry is a separate story from the auction
Day two was a weekly NIFTY expiry, which conflated two effects that day-three data separates.
What belongs to the auction, present on non-expiry days too: options reprice continuously through the window in which the cash index that references them is frozen. On day two the 24600 put fell from 129.05 to 39.45 — a 69% collapse — before the cross, while the index it references had not moved at all. Options were tracking the futures and the auction's indicative price, both live; the index print was the only stale number on the screen. The same structure is visible on day three.
That is the honest explanation of the manipulation complaint. For about thirteen minutes the most-watched number on a retail screen is frozen and stale while the instruments priced off it keep moving. A trader watching spot sees nothing happening and their option position moving anyway. That is a real grievance about information display and market design. It is not, on this evidence, proof of price manipulation.
What belongs to expiry, and is absent otherwise: on day two, open interest at the 24600 put — the strike the auction close landed just above — rose 160.7%, while the calls the restatement moved through lost roughly half their open interest (24500 CE −59.3%, 24550 CE −58.2%, 24400 CE −54.8%). On day three the largest OI change anywhere in the chain is +2.1%, with everything else drifting −5% to −34%. Ordinary position runoff. No pin, no spike.
India VIX, meanwhile, was flat or slightly falling across the close on all three days (11.97→11.98, 12.19→12.14, 12.12→12.09). Whatever this is, it is not a volatility event. It is a spot and delta effect. Any account reaching for "volatility spike" is contradicted by the data.
The practical consequence for anyone selling near-the-money premium into a Tuesday expiry is structural rather than statistical: for thirteen minutes the underlying cannot be hedged in the cash market, and then it gaps in a single tick. Positions that were out-of-the-money at 15:14 can finish in-the-money with no opportunity to do anything about it. That risk is unhedgeable by construction, not merely large, and it does not require a single day's P&L figure to establish.
This is the one place where I will state something close to a recommendation, because it does not depend on a measured average — it depends on the mechanism, which is visible in three sessions out of three. Do not hold short naked premium through the auction window on an expiry day. The hedge instrument is unavailable precisely when the gap occurs. On non-expiry days the directional risk is still there but the terminal-payoff risk is not, which is a materially safer situation without being a safe one.
The mirror-image trade — buying gamma into a structurally near-certain single-tick jump while implied volatility sits flat — is more interesting and I want to be careful not to oversell it. Costs are genuinely not the obstacle: a round-trip on two lots of a ₹50 option breaks even on a 0.99% move, against observed moves that were multiples of that. The obstacle is that the jump is shrinking fast. Two hundred index points, then one hundred fifty, then fifty-two. A straddle pays theta into the most expensive hours of expiry day to capture a move that has lost three quarters of its size in three sessions. I have not backtested it, the decay is running against it, and I would not put it on based on this post.
What three days cannot tell you
I have been careful about this throughout and want to collect it in one place, because the temptation to over-read a new market structure is strong and the first week is when every claim is cheapest to make.
Three sessions is not a sample. The market-level decay from +46.9 to +16.0 basis points is a direction, not a trend, and day three's intraday range was smaller than day two's — so some of what I am calling decay could be a quiet day. Two overnight transitions cannot distinguish a stable cross-sectional effect from two draws that happened to tilt the same way — a replicated slope is much better than a single one, but n=2 is still n=2. I have no observation of a genuinely violent close, or a large index rebalance, or a stressed market, and those are exactly the conditions under which a thin auction is most likely to behave differently.
And the central mechanism question — why the clearing price has been biased upward on all three sessions, twice against the day's own direction — is not answerable with a retail feed. It needs the auction book.
What I would defend: the freeze is real and total, the restatement arrives in a single tick, the cross fires before the published window and at a different time every day, the futures market does not ratify the auction, the effect is concentrated in large caps, the market-wide magnitudes are falling, large auction moves partially reverse overnight in the auction group and not in the control on both transitions measured, and liquidity migrates to the stocks that keep trading.
What I would not defend: any claim that either the overnight fade or the cash/futures spread is an established edge, any claim about why the auction clears where it does, and any suggestion that three up-closes establish a permanent upward bias. The one thing in the trading direction I will state without hedging is negative — do not carry short naked premium through the window on an expiry day — because it rests on the structure of the mechanism rather than on an average I have measured three times.
The opinion
The loudest complaint about the closing auction — that the close is being manipulated — is the one the data can least support, and the quietest observation is the one that turned out to matter.
The manipulation claim requires the auction order book to evaluate, and nobody making it on social media has that book any more than I do. What the data does support is narrower and, I think, more interesting: for thirteen minutes a day the number most retail traders treat as the price is stale, while every instrument that references it keeps moving. The grievance is real. Its object is information display, not manipulation. Those get conflated because the experience of watching a position move against a frozen screen feels identical either way.
Meanwhile the thing nobody wrote a thread about — that several hundred stocks with no auction at all are measurably busier during the auction window, and increasingly so — got no attention whatsoever, because it does not produce a dramatic candle on a chart anyone was watching.
That asymmetry is the general lesson, and it is not specific to Indian market structure. The visible artifact of a change attracts all the analysis. The second-order effect on the population that the change formally excluded is where the unexploited information usually is, precisely because measuring it requires you to have set up a control group before you knew what you were looking for.
I set that control group up to answer a different question. It answered this one better.